Quick Summary
The Laravel Debugbar is an essential development tool that provides a real-time diagnostic dashboard for your application. It offers immediate visibility into database queries, performance timelines, memory usage, and executed views. So developers can quickly identify bottlenecks, debug errors, and optimize their Laravel code efficiently.
Table of Contents
Every developer knows the frustration of a bug in their program. You’ve built a feature, but something is broken, slow, or simply not working as expected. When you know what it is, it may be easy to rectify it. But finding the root cause can feel like searching for a needle in a haystack.
For that reason, Laravel Debugbar is an indispensable tool. As evident by its name, this powerful package integrates a debug bar directly into your application. It provides real-time, visual insights into queries, timelines, and performance metrics.
What is Laravel Debugbar?
The Laravel Debugbar is a free, open-source package that integrates a toolbar to debug Laravel applications. It’s like a diagnostic dashboard that provides real-time visibility into your application’s inner workings during development.
Once you install it, there’s a transparent bar at the bottom of your browser window. It offers a wealth of information, including:
- Database Queries: See every SQL query executed on a page, including how long each one took.
- Timeline: A visual breakdown of your application’s bootstrapping process and execution time.
- Views & Routes: Identify which views were rendered and the current route being executed.
- Memory Usage: Monitor how much memory your application consumes.
With the immediate feedback from Debugbar, you can identify performance bottlenecks and debug logic errors. You can even optimize your code for a smoother, faster application.It’s like an alternative to Laravel Tinker, which helps test and debug logic directly through an interactive command-line interface.
Key Features of Laravel Debugbar
With Debugbar, you get a range of critical features that make it one of the top Laravel development tools. Let’s discuss a few of them.
Query Monitoring
Debugbar logs every executed SQL query. That helps display the statement, execution, and the calling code location. With this feature of Debugbar in play, you can easily identify slow performance and the notorious N+1 query problem.
Models & Relationships
Working with query monitoring, this feature shows you exactly which models are being hydrated. And you can see how your relationships are being accessed.
Route Information
Instantly view the current route name, the controller handling the request, and any applied middleware. This provides immediate clarity on the request’s lifecycle.
Request Data & Response Metrics
Inspect all incoming input, cookies, and headers. Simultaneously, monitor response metrics like the total execution time and memory consumption to gauge overall page performance.
Session & Authentication Data
Safely debug what data is stored in the user’s session and check the current authentication status. That includes the logged-in user’s ID and attributes.
Together, these features transform debugging from a guessing game into a precise, data-driven process.
Overview of Debugger Interface
The Laravel Debugbar presents its data through a collapsible icon-based toolbar at the bottom of your browser. Each tab provides a specific diagnostic insight into your application’s execution.
Here’s a breakdown of the most common tabs and their purpose:
Messages
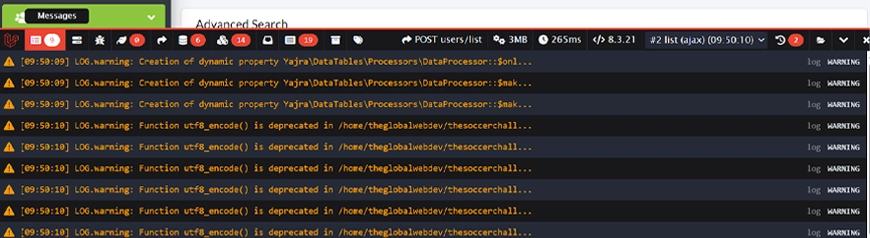
Log custom messages, variables, or debug output directly to the Debugbar. It’s an alternative to dd() or var_dump() that keeps your application running. So you can trace values and execution flow without stopping the page load.
Timeline
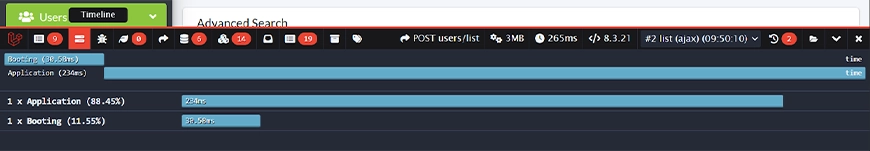
Visualizes your application’s execution as a horizontal bar. It breaks down the bootstrapping process, showing how long each part takes. This is your first stop for identifying major performance bottlenecks and understanding where your application spends its time.
Exceptions
Displays a list of any exceptions or errors thrown during the request. It provides the error message, file, and line number. That acts as a centralized error log directly within your development environment for quick debugging.
Views
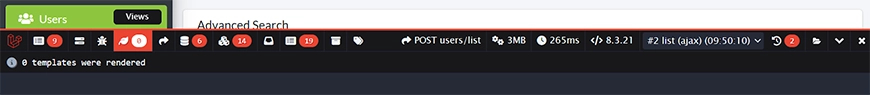
Lists all Blade templates that were rendered to build the current page. It shows the view name and the data passed to it. That helps you verify the correct templates are loaded and track down data scope issues.
Route
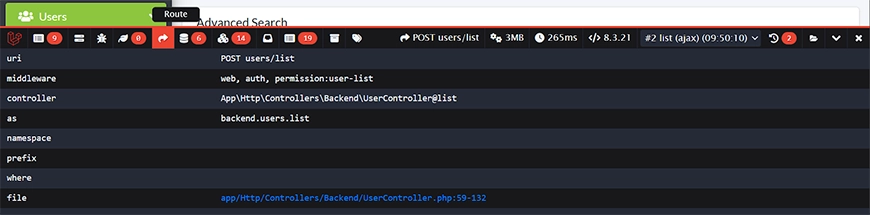
Shows the current route name, controller action, and HTTP methods. This confirms the intended route is being accessed and provides a quick reference for the underlying logic handling the request.
Queries
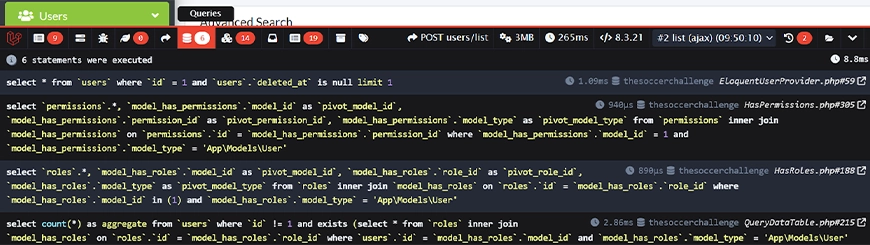
The most-used feature; it lists every SQL query executed, including their bindings and execution time. It is essential for spotting slow database calls, detecting the N+1 query problem, and overall SQL optimization.
Models
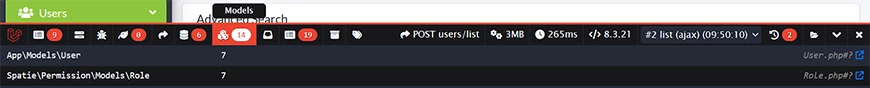
Displays the Eloquent models that are currently loaded, along with their attributes. This helps you inspect the actual data inside your model instances and understand the state of your objects during a request.
Mails
Previews any emails that were “sent” during the request while in development. It captures the email’s subject, recipient, and HTML content. So you can verify email formatting and logic without actually sending a message.
Gate

Provides insight into Laravel’s authorization system. It shows a log of policy and gate checks, displaying the ability being checked, the result, and any relevant arguments. It simplifies the debugging of complex permissions.
Session
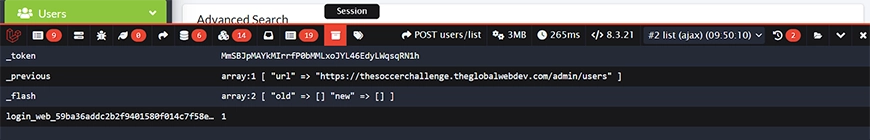
Reveals all data stored within the current user’s session. You can instantly inspect session keys and values. That makes it easier to debug state management and authentication-related data across requests.
Request
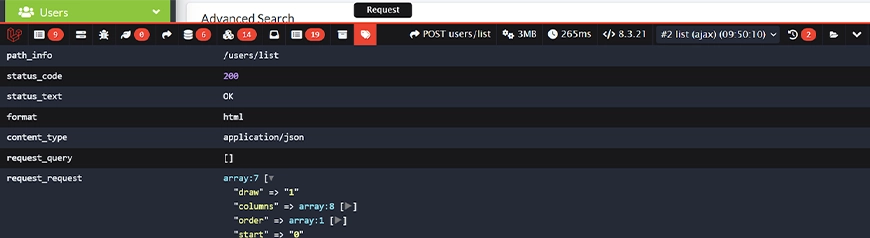
Details all incoming HTTP request information, including the URI, headers, and request methods. It offers a complete overview of the client’s input. That is vital for debugging API calls and form submissions.With Laravel Debugbar, you get a comprehensive, real-time audit for the web application. For this and other advanced implementations, you can hire dedicated Laravel developers with us.
How to Set Up Laravel Debugbar?
Integrating the Debugbar into your Laravel project is a straightforward process. You can complete it in minutes using Composer.
Step 1: Install via Composer
Begin by installing the package into your Laravel application using Composer. Run the following command in your terminal from the project’s root directory:
composer require barryvdh/laravel-debugbar --dev
Now that Debugbar is installed, you can use Laravel Pint, the code-style automation tool, for efficient debugging and cleaner code practices.
Step 2: Configuration
The latest Laravel versions support package auto-discovery. The service provider and alias are automatically registered, so no manual configuration is typically needed.
Publish the Debugbar configuration file with:
php artisan vendor:publish --provider="Barryvdh\Debugbar\ServiceProvider" --tag="config"
This creates a config/debugbar.php file. There, you can customize Debugbar settings (such as enabling/disabling and tab customization).
In the debugbar.php config file, ensure the ‘enabled’ value is set appropriately:
'enabled' => env('APP_DEBUG', false),
This means Debugbar will follow the value you set for APP_DEBUG in your .env file.
Step 3: Enable Debug Mode
The Debugbar is configured to only activate when your application’s APP_DEBUG environment variable is set to true. Confirm this is the case in your local .env file:
APP_DEBUG=true
While it’s optional, we recommend you clear and cache your config to apply the changes:
php artisan config:cache
Step 4: Start Debugging
Once installed and configured, the Debugbar will automatically inject itself into your application. Simply load any page in your browser, and you will see the debug bar appear at the bottom, ready for use.
You’ll see the Debugbar at the bottom of your page. That provides real-time data about queries, memory usage, rendered views, routes, and more. Use the Debugbar features to troubleshoot, profile performance, and optimize your app during development.
Best Practices for Using Laravel Debugbar
Laravel Debugbar, by default, is pretty efficient. But still, to use it effectively and securely, you will have to adhere to some key best practices.
Enable Only in Development Mode
Debugbar is supposed to be a development tool. APP_DEBUG=false disables it automatically. So you have to make sure this variable is always set to false on your production server. Otherwise, there might be accidental exposure.
After the development is done, you can use Debugbar in tandem with Laravel Telescope. It’ll help monitor requests, exceptions, and database queries in depth.
Never Use It in Production
Again, since Debugbar is a development tool, you shouldn’t use it in production mode. Otherwise, it can expose sensitive information like database queries, session data, and application logic. Running it on a live site (even accidentally) poses a security threat. Plus, it can degrade the performance.
Implement Data Masking for Sensitive Info
Even in development, you may work with real user data. Configure the Debugbar to mask sensitive fields such as passwords, API keys, and credit card numbers. This prevents sensitive data from being visible in query logs or session dumps.
Use Selective Data Collectors
Laravel Debugbar collects a lot of information throughout the development. If you don’t need a specific tab for your current task, disable its collector in the configuration file, (config/debugbar.php). It can help reduce performance overhead.
Add Custom Logs for Clarity
Go beyond passive observation. Use debugbar()->addMessage($variable) to log specific variables or track the execution flow of complex functions. It provides crucial context directly within the Debugbar interface.
For complex Laravel projects, consider partnering with the experts. Their experience in leveraging the Debugbar alongside other best practices can ensure your application runs smoothly.
Also, they implement required practices as per the trend to ensure the application scales and adheres to the highest security standards.
Let’s Conclude
Debugging your Laravel app doesn’t have to be complicated. With Laravel Debugbar, you can quickly identify errors, monitor performance, and keep your application running smoothly. It’s a tool trusted by both beginners and experts for its simplicity and efficiency.
Now that you know how to use Laravel Debugbar, you’re ready to streamline your debugging process and focus on building better applications. Give it a try and see how it transforms the way you work.
Or if you want to make an error-free, high-quality web application, consider partnering with a professional Laravel development company today!
FAQs About Laravel Debugbar
Can I customize and extend the Laravel Debugbar to suit My Needs?
Absolutely! The Debugbar offers extensive customization options. You can disable or enable specific collectors, and even modify the displayed information. The Debugbar’s extensibility allows you to tailor the debugging experience to your specific workflow.
How do I enable debug logs in Laravel?
While the Debugbar provides valuable insights, it doesn’t directly enable traditional debug logs in Laravel. Yet, enabling debug mode in your .env file (by setting APP_DEBUG to true) will display more detailed error messages within your application.
How can the Laravel Debugbar help improve the application’s performance?
The Debugbar doesn’t directly improve application performance. Yet, it acts as a powerful performance profiler. By analyzing data like database query execution times and memory usage, you can identify performance bottlenecks within your code.