Quick Summary
Laravel Telescope is an elegant debugging and diagnostic assistant specifically designed for the Laravel PHP framework. It provides a web-based dashboard that offers real-time insights into various aspects of a Laravel application during development. Know about Telescope by Laravel more in this article.
Table of Contents
Laravel debugging is difficult and time-consuming. Laravel Telescope simplifies this issue easily. This particular debugger gives very detailed behaviour insights for your application.
This tool’s new-age and neat-looking dashboard tracks requests, queries, errors, and a lot more. Basically, it avoids debugging guessing. So, development gets faster and more efficient.
But what is Laravel Telescope? It aids application diagnosis. What does this debugger monitor in real time? How do you see everything in your Laravel app? In this article, you will get to know how to install Laravel Telescope, why to use it, how to use it, and a lot more, so let’s get into it…
What is Laravel Telescope?
Laravel Telescope provides complete debugging and insightful monitoring. Its dashboard gives X-ray visibility into your app’s components and is part of a broader set of Laravel development tools that together improve productivity and reliability. It also clarifies incoming requests, shows database queries in a nice way, and shows exception sequences.
- Concentrate on slow database queries.
- Finding problems quickly.
- Track mail deliveries in real time for smooth communication and user satisfaction.
- Gain useful code execution information.
- See scheduled tasks and queued jobs. This lets you fully control app asynchronous actions.
Debugging and performance optimisation are both Laravel Telescope’s strengths. You can construct stable, efficient, and completely new Laravel apps with these actionable insights.
Why Use Laravel Telescope for Debugging and Monitoring?
Complex applications can feel like uncharted territory for Laravel developers. Log analysis and hidden message analysis are mostly needed to find what are all the unfixable issues and optimize efficiency.
But to do this in a more professional and systematic way, Laravel Telescope comes in! It is constantly updating your application’s inner workings, and it also makes sure that they are fully visible. With this sleek debugging and monitoring tool, experts can help you use it properly.
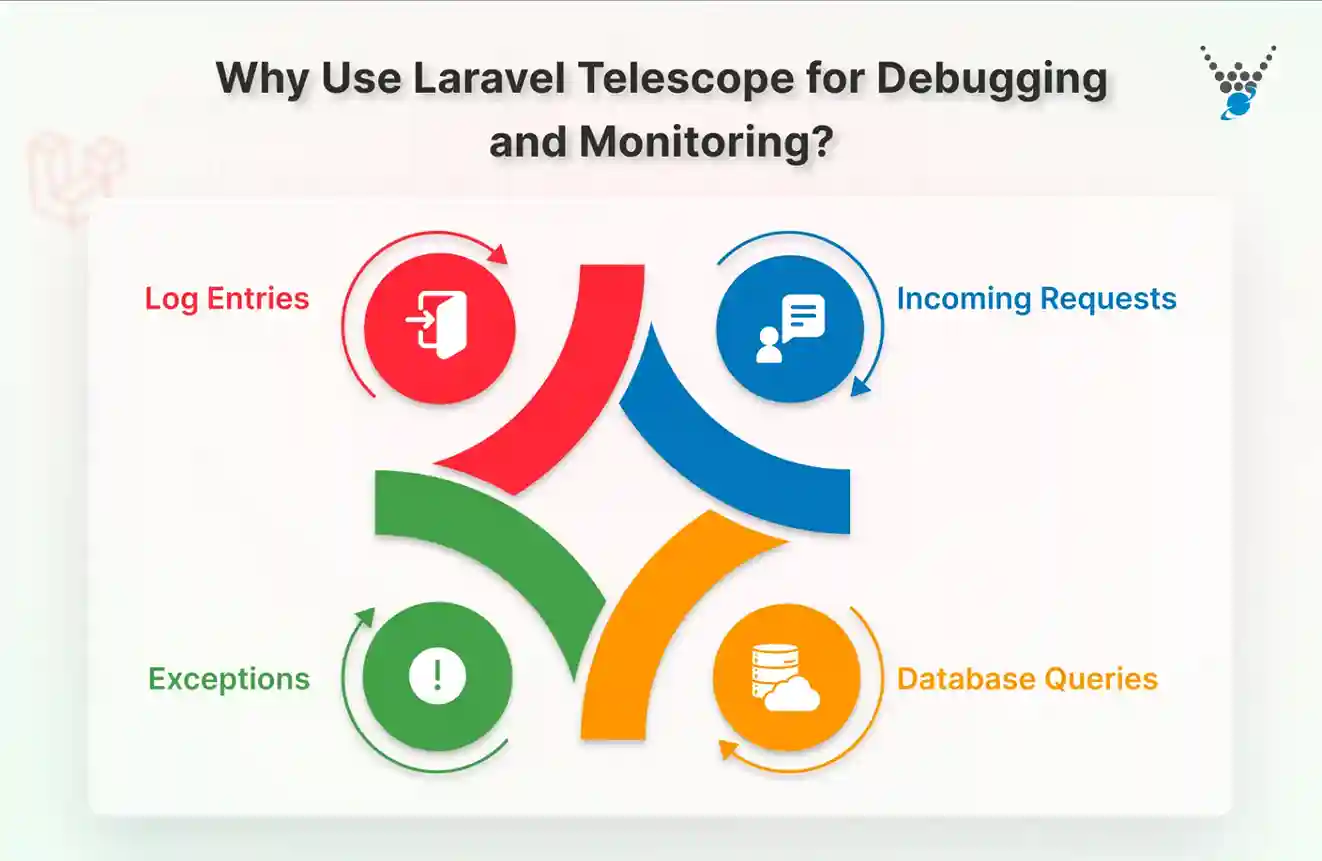
1. Incoming Requests
Ever thought about what problems Laravel app users actually face? What pathways do they pursue, and where may things go wrong? Even if you haven’t, what they have done is address it, and with Laravel Telescope, it lets you see your app’s user experience. With this, you can:
- Learn User Journeys: Visualize user requests in order. Find drop-off locations and optimize conversion funnels for smoother sailing and use Laravel Tinker to test request handling and service logic interactively while investigating those flows.
- Find Security Flaws: See suspicious requests before they become issues. Locate illegal access attempts and secure user data in your app.
- Troubleshoot Authentication: Fix login flow issues and streamline onboarding for a great first impression.
- Examine API Usage: Monitor API calls and ensure all users have a damn good experience.
- Understand User Behavior: Analyze user interactions with individual parts and make data-rich decisions to increase app engagement and usability.
No more blind flying with the Laravel Telescope. You know how users utilize your software. This will help you to create intuitive, enjoyable, and secure experiences.
2. Database Queries
A slow database query might destroy app performance. Laravel Telescope lets you track these wasteful queries, performance bottlenecks and will also show you real-time database interactions. Apart from that, it identifies slow queries, parameter binding issues, and code locations. The best part about Laravel Telescope is that it even lets you diagnose and fix query performance issues fast. And the cherry on top is that it finds queries to cache, making your database faster and leaner.
So, installing Laravel/Telescope gives developers quick query clarity and improves performance, which complements frontend optimization using Laravel Mix to reduce asset load and improve overall page responsiveness.
3. Exceptions
Unexpected exceptions occur in any app. Laravel Telescope records every error, maps its sequence, and immediately finds its source. Then, it breaks down the language and reveals what went wrong and under what conditions. Telescope Laravel provides issue context, with request data, environment facts, and stack traces. The root cause is that historical error data might help you identify recurring issues and improve app stability.
Laravel/Telescope teams can simply share exception reports, thereby increasing debugging efficiency. Consider Laravel Telescope installation for your error tracing and debugging command center.
4. Log Entries
Laravel Telescope makes it easy to figure out what cryptic logs mean. It turns raw log data into useful information that shows trends and connections that people typically overlook when they do it by hand. With Laravel’s Telescope, developers can keep an eye on important events, find problems, and do maintenance before they happen.
Contextual intelligence gives you full transparency by adding variables, requests, and session data. When you install Laravel Telescope, you can share logs with other people, which helps teams debug quickly and more intelligently by changing logs from confusion into clarity.
So, want to get the best out of this Laravel package for your web application? Then consult with our Laravel development company.
Laravel Telescope vs Laravel Debugbar vs Other Monitoring Tools
| Tool | Features | Pros | Cons |
|---|---|---|---|
| Laravel Telescope | Request tracing, database query monitoring, exception tracking, job queue analysis, log exploration, rich visualizations, and advanced storage | Deep Laravel integration, advanced debugging, historical analysis, customizable watchers, secure (when configured properly), supports Laravel trace request | Not recommended for production, can expose sensitive data, more resource-intensive, requires manual pruning |
| Laravel Debugbar | Real-time insights in browser, queries & routes, timeline, log debugging, compact UI | Easy setup, lightweight, instant feedback, perfect for quick debugging, browser toolbar, minimal impact | Limited historical storage, less deep profiling than Telescope in Laravel, lacks job/queue analysis |
| Others (Sentry, New Relic, etc.) | Centralized error tracking, performance metrics, user monitoring, cross-platform support | Rich analytics, error alerts, works on any stack, cloud dashboards, robust integrations | Often paid, complex setup, generic (not Laravel/telescope-focused), no deep Laravel/Telescope-level traces |
How to Use Laravel Telescope for Debugging?
Laravel Telescope lets developers show how their code works on the inside. Its interface and monitoring features turn debugging from a boring chore into an exciting detective story. Let’s look at the easy actions you need to take to install Telescope and use its power:
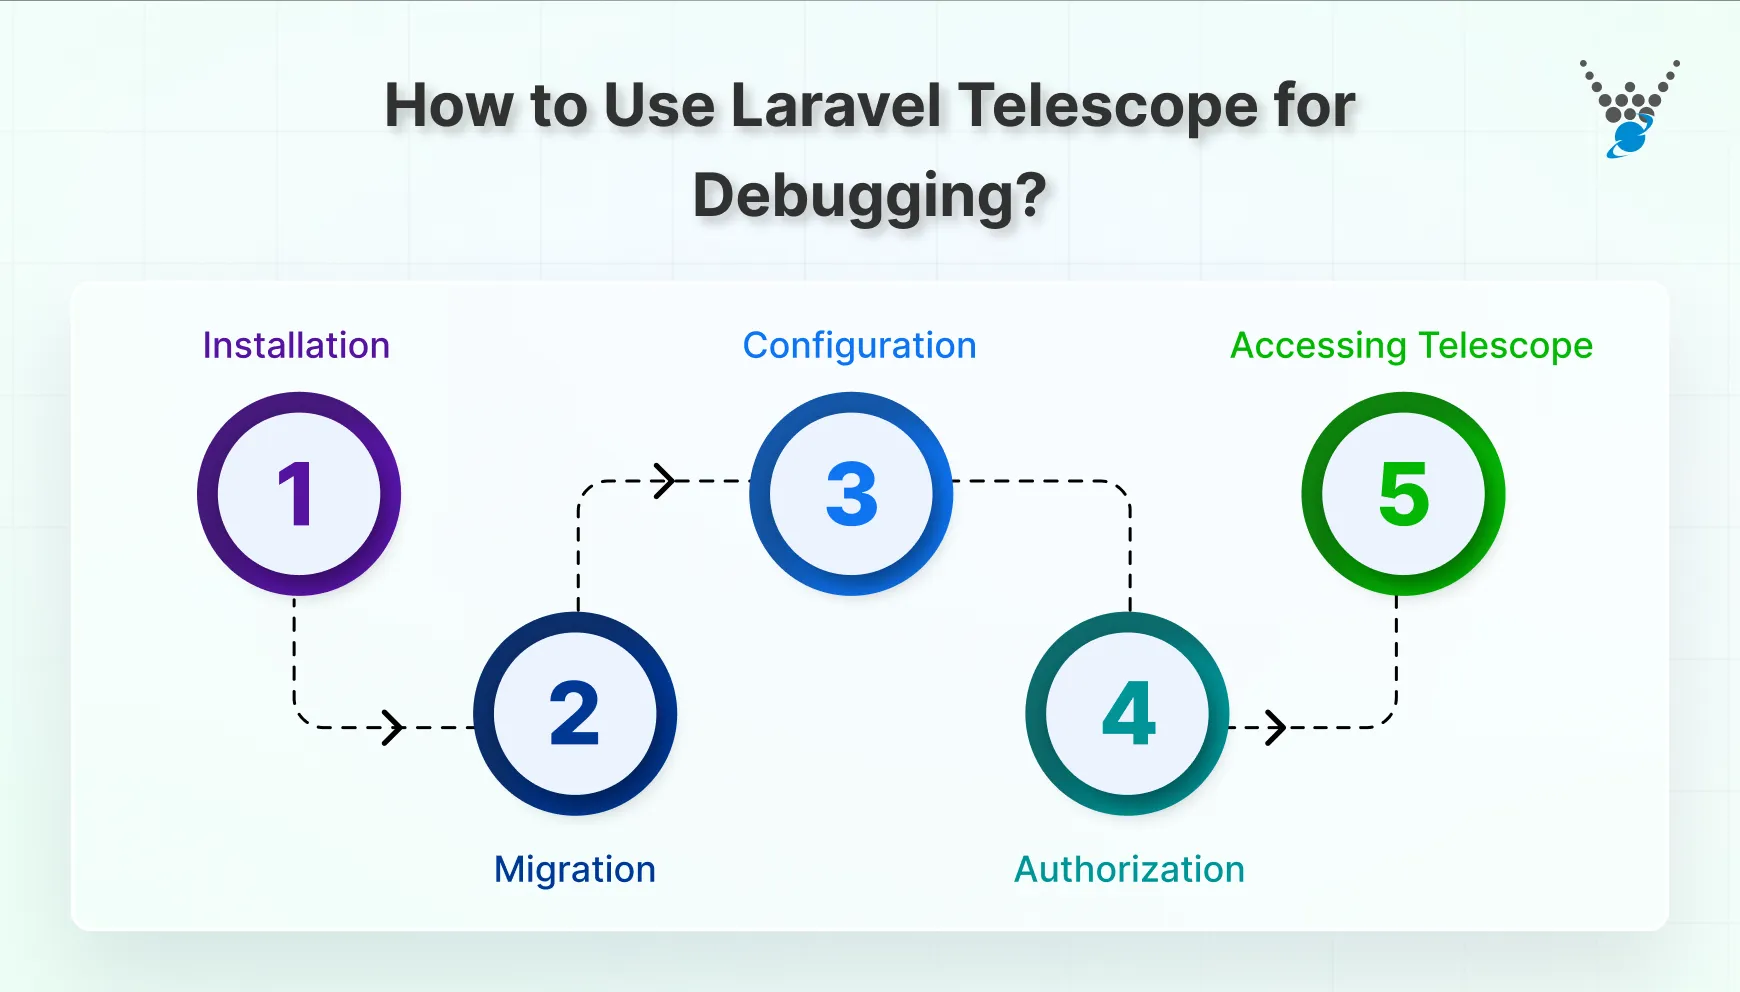
1. Installation
We are aware of the fact that one gets sick of trying to figure out cryptic logs and find bugs that are hard to find. Let Laravel Telescope be your inspiration for such debugging. Installing this stylish helper is easy, and in just a few minutes, your problems will be either fixed or at least addressed.
- Composer: Run composer require laravel/telescope –dev into your terminal. This gathers the Telescope and its instruments to solve your code’s puzzles.
- Migration: Next, run “php artisan migrate”. This establishes the hallowed database chambers where the Laravel Telescope will store insights.
- Configuration: Telescope, like any great tool, thrives on customization. Scroll through “config/telescope.php” to customize settings. Select the database connection, prune data for order, and add an authorization layer.
These three easy steps start Laravel Telescope debugging.
2. Migration
After installing the Laravel Telescope, you must be eager to unlock its debugging benefits. But there’s one crucial step remaining: migration. This process constructs the database structure necessary to house Telescope. This is to strengthen your debugging and make sure it has a solid foundation upon which to build.
- Start Command Migration: Open your terminal and run the following command. This adds your database with Telescope’s data-capturing capabilities:
php artisan migrate
- Witness Creation: As the migration begins, check the formation of tables specifically designed to store information regarding:
- Incoming requests
- Database queries
- Executed commands
- Thrown exceptions
- Mailed messages
- Queued jobs
- Scheduled tasks
- Log entries
- Verify Completion: Once the migration completes, confirm its success by inspecting your database schema. You’ll find the newly-made tables, ready to start monitoring your application’s activity and address hidden insights.
With migration complete, you’ve prepared a sturdy warehouse for Telescope’s observations. Now, as your application runs, Telescope diligently gathers data and shows the inner workings. This treasure trove of information empowers you to:
- Pinpoint performance bottlenecks with precision.
- Unravel error chains with ease.
- Understand user interactions at a granular level.
- Monitor asynchronous tasks effectively.
Remember, these tables are made to store sensitive information. It’s important to exercise caution and grant access only to trusted people.
3. Configuration
After installation and migration, Laravel Telescope is ready to provide a bright picture of your application’s activity. Customize it before diving into its insights. Make sure that your debugging experience meets your needs and preferences.
- Open the Configuration Scroll: Open the “config/telescope.php” file.
- Forge a Database Connection: Give the telescope a clean channel to store observations. In the “storage” settings array, specify the database connection:
'storage' => [
    'database' => [
        'connection' => env('DB_CONNECTION', 'mysql'),
    ],
],
- Prune for Efficiency: If unchecked, Telescope data can grow large. Optimise performance using data trimming. This option keeps insights for 7 days, preserving useful data and reducing clutter.
'pruning' => [
    'enabled' => true,
    'keep_for_days' => 7,
],
- Guard Your Secrets (Optional): Protect sensitive data using an authorisation layer. You can restrict Telescope dashboard access. Thus, it protects sensitive application data.
'enabled' => env('TELESCOPE_ENABLED', false),
'filter' => [
    // Define filters for included/excluded data here
],
'middleware' => [
    'web',
    // Add authorization middleware here
],
- Customize for Work: Make your debugging experience according to your preferences with more config/telescope.php options:
- Change the dashboard default route.
- Enable/disable data collectors to target specified locations.
- Set up secure authentication.
Your careful configuration has made the Laravel Telescope a perfect debugging tool. Now that you have the skills to use it, explore confidently.
4. Authorization (Optional)
Laravel Telescope aids debugging and optimization by showing your application’s inner workings. But tremendous knowledge comes with tremendous responsibility. To ensure sensitive information doesn’t fall into the wrong hands, consider implementing authorization measures Gates or Policies.
- Go to Configuration: Open “config/telescope.php”. Control debugging dashboard access using these tools.
- Gather the Authorization Gatekeeper: The configuration file contains the
middleware array. Add middleware to enforce authorization here:
'middleware' => [
    'web',
    // Add authorization middleware here
],
These methods protect Telescope’s insights, allowing only authorized users to access your application’s depths. This protects sensitive data while allowing Laravel project optimization and debugging.
5. Accessing Telescope
Now Laravel Telescope can show your app’s inner workings. It was carefully installed, moved, configured, and secured. Now is the moment of revelation: enter the portal and discover the Telescope dashboard’s debugging insights. Next Steps:
- Go to: “/telescope” in your browser. This opens a world of vital knowledge. Typically comprises application requests, inquiries, commands, exceptions, and more.
- Pass the Guardians (If Required): Provide credentials or permissions to enter if you’ve implemented authorization.
- Check the Dashboard: After login, the Telescope dashboard displays many insights:
- Requests: Check headers, cookies, session data, and more in every application request.
- Queries: Perform database analysis to find sluggish queries and improve performance.
- Commands: Understand how executed commands affect your application.
- Exceptions: Track error chains, find causes, and fix problems.
- Mail: Check sent emails for content and delivery.
- Jobs: Monitor queued and planned jobs to identify bottlenecks and ensure smooth operation.
- Logs: Examine application-specific log entries for complete event and action information.
- Explore Using the Search Function: Use Telescope’s search, filtering, and detailed views to find insights. Fix issues, boost performance, and improve your app’s experience.
Laravel Telescope makes debugging an exciting way to work. Now you can see a lot of what was missed, even from expert eyes, and build Laravel apps with great user experiences.
Final Notes and Next Steps
No more reported problems or unclear application behavior! Debugging becomes a fun adventure with Laravel Telescope, which shows your project. Its extensive features reveal requests, inquiries, failures, and more. You can improve performance, troubleshoot with laser focus, and design applications with confidence with Laravel Telescope.
Consider Laravel Telescope for debugging! Find sluggish queries, solve error chains, and optimize your application. Remember, knowledge is power, and the Laravel Telescope gives you the power to create amazing Laravel experiences.
Keen to unleash the full potential of your Laravel projects? Don’t go it alone! Hire Laravel developers with us today!
FAQs About Laravel Telescope for Debugging and Monitoring
What is the difference between Laravel Telescope and Horizon?
– Telescope: The Telescope is your forensic detective! Detailed analysis of requests, inquiries, errors, etc. It helps you diagnose and optimize performance.
– Horizon: Your taskmaster, monitoring queued jobs and ensuring background processes operate properly.
What is the best feature of the Laravel Telescope?
The “best” feature is subjective, but contenders have:
– Granular Request Inspection
– Exception Debugging with Depth
– Intuitive Dashboard
Remember, the most important feature is the one that solves your development problems.
How do I know if Laravel Telescope is in debug mode?
Instead of a toggle, Laravel Telescope uses environment settings. It immediately activates in development environments for fast debugging. See its status:
– Telescope Dashboard Access: If /telescope welcomes you, it works.
– TELESCOPE_ENABLED Environment Variable: True means Telescope is monitoring.
– Safety First: Disable Telescope in production to protect critical data.
Is Telescope production safe?
Laravel Telescope is meant for local development and debugging, not production. The Telescope can reveal critical database queries and logs in production, compromising application security. If production use is necessary, restrict Telescope access with authorization gates. Laravel Telescope should be disabled in production, save for short-term troubleshooting.
How do I prune Telescope data?
Telescopes generate lots of records quickly. Schedule telescope: prune Artisan to erase items older than 24 hours. For 48-hour retention, use telescope:prune –hours=48. Keep database size manageable with Laravel scheduling automation.
Should I use Telescope or Debugbar?
Both Telescope and Debugbar are great Laravel debuggers, but for distinct purposes. Laravel Debugbar is a lightweight, easy-to-use, and browser-integrated tool for daily work and speedy debugging. However, Laravel Telescope provides deeper insights (requests, queries, exceptions, jobs) and stores data for later analysis, making it ideal for advanced profiling and tracking. Simple and quick feedback from Debugbar; extensive, long-term introspection from Telescope.
How does Laravel Pennant work with Telescope during feature rollouts?
Laravel Pennant provides feature flagging so you can toggle features safely; use Telescope to observe request and exception patterns while rolling features out to subsets of users.